SmartLearning is a multi-faceted online tool in response to declining education performance in the United States. Our goal is to improve the academic performance of K-8 students using various types of learning assessments. This data will be used to group students and optimize learning processes.

SmartLearning
MY ROLE
This project was the final project for a Management of Technological Organizations course, and it simulated a business-creation process. I was the designer for the sketches, low-fidelity, and high-fidelity prototypes.
HIGH-FIDELITY PROTOTYPE

Home Page
The home page introduces the website and displays the organization's goals. It does scroll down to a footer containing a link to log in or sign up for the service.
Student Dashboard
The student dashboard showcases the assignments students need to complete while participating in SmartLearning. It distinguishes the Math and Reading sections by color.

_edited.png)
Grades Page
This page stores the grades automatically after the student completes the Dashboard assignments. It also differentiates the subjects with the same color scheme as the Dashboard page. The bolded numbers emphasize the grade percentages.
Contact Us
The preview cuts out the navigation page to showcase the entire ticket section. The Contact Us page provides FAQ links and a pre-filled example to showcase the text appearance of any user inputs.
.png)
.png)
Discussions Page
The Discussions page is where students can ask their teacher and peers questions. The page also hosts announcements by the SmartLearning team and the teachers. These sections are separate for organization and prioritizing announcements.
Profile Page
The student profile contains a biography, an image, and their most recent posts on the Discussions page. It can be reached by clicking on their name in their posts and the icon on the top right corner.
.png)
UNDERSTANDING THE USER
Our team established our project topic after conducting research into education research methods and processes and how to utilize the data to benefit the users and other stakeholders in the long term. By using our website, students will be able to find learning strategies that best suit their personal needs and interests to perform well academically. This product would be offered to administrators as they will be required to distribute it to each student to utilize.
The reality is that students are disengaging with their education, spending less time pursuing academic goals, and falling behind international math/science standards.
Understanding that the demographic is primarily students and educators, I knew to make the design more straightforward and minimalist. This design does not overwhelm users and provides a more natural reading structure.
THE PROCESS
Before our group initiated the prototype-making process, SmartLearning underwent planning and research for user goals and methods to reach our objectives. These were summarized in a Context Diagram to show what we would receive from/provide to our users and a Cross Functional Flow Diagram to view the data collection and analysis process.
Context Diagram

Cross Functional Flow Diagram: Data Collection and Analysis
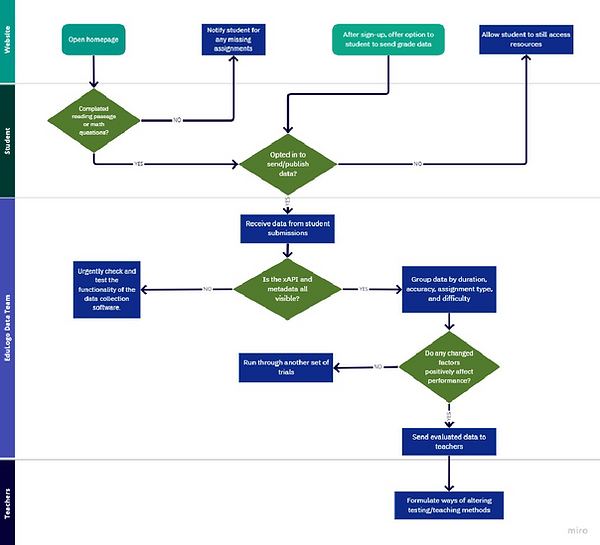
These diagrams showcased what to emphasize on the website as our introduction and how we would collect data via SmartLearning. I made these diagrams using the Miro online program.
Before starting up Figma for the high-fidelity prototype, I sketched some pages and made the low-fidelity prototype on Procreate. It provided the basic structure of the pages and the overall essential parts of setting up the skeletal design of the website.
.png)
I based a lot of design inspiration on Khan Academy as it had the minimalist, organized look I wanted to duplicate for SmartLearning. Khan Academy's users range from Kindergarten to college-aged students to school administrators, so SmartLearning's design can appeal to its similar audience to Khan Academy.
REFLECTIONS & NEXT STEPS
In creating SmartLearning, I learned different business models and research processes before making the high-fidelity prototype. I worked with SWOT Analysis, context diagrams, and cross-functional flow diagrams. On Figma, I made a lot of transitions between the site pages because the assignment required most aspects of the site to be interactive. Also, I worked a lot on organizing a massive file by grouping layers into sections with clear names.
In future projects, I want to work with mobile interfaces because it would broaden my experience in Figma prototyping. According to the Pew Research Center, 85% of Americans use smartphones, increasing by 50% in ten years. This growth reflects on the tech industry, which requires a more appealing, readable design for primarily phone users. I want to bring the knowledge I learned about research and diagram-making to projects in my further educational and professional career in interaction design.